HTML Data Table Templates: CSS and HTML Examples
Data tables are essential for displaying large sets of structured information like product catalogs, sales reports, schedules, and statistics. With HTML and CSS, you can make tables visually appealing, readable, and easy to use.
In this article, we’ll explore multiple HTML data table templates with CSS styling and teach you how to customize them for your projects. By the end, you’ll be able to build long, practical tables that are clean, functional, and professional-looking.
01. Selectable HTML Table with CSS & JS
.png)
This example is a modern data table with a “select all” checkbox to select the entire list in one click.
-
A “Select All” checkbox that checks/unchecks all rows with a single click.
-
Hover effect for rows.
-
Separated files (HTML, CSS, JS) so you can preview and export easily.
02. Sortable Data Table (HTML, CSS, JS)
.png)
This is a sortable HTML data table. Users can click any column header to sort the rows alphabetically or numerically, making it easy to organize data. The table features a clean gradient header, hover effects, and a responsive card-like layout for readability.
It’s fully customizable, so you can add more columns or adjust styles to match your website design.
03. HTML Data Table with a Fixed (Sticky) Header
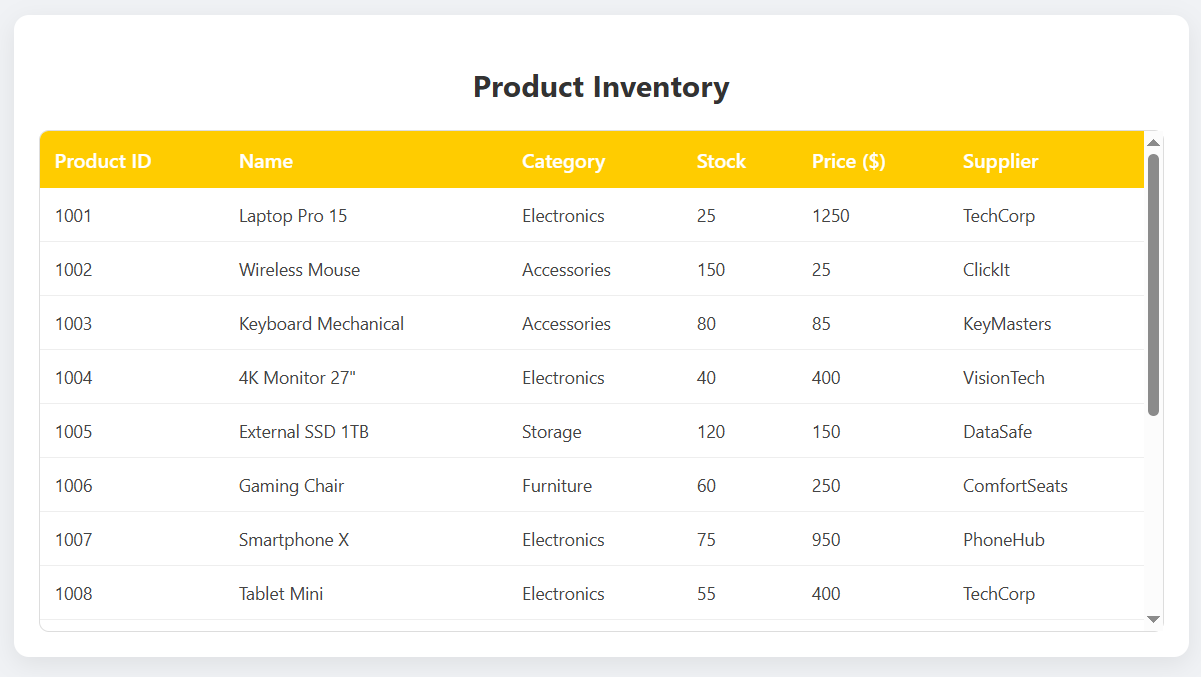
This is a HTML data table with a fixed header. The header stays visible while scrolling through a longer dataset, making it easy for users to track column labels.
The table includes a scrollable body with over 15 rows of data, subtle hover effects, and a clean card-style design. This type of table is perfect for inventory lists, reports, or any large dataset that needs better readability on a webpage.
Also use our Free Online HTML Table Generator to make tables faster.
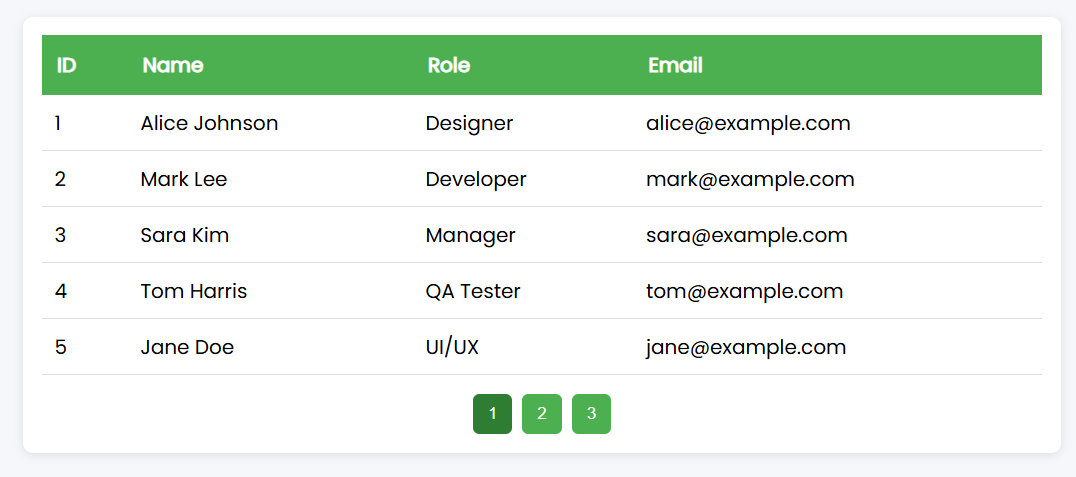
04. Data Table with Pagination
05. Searchable Data Table
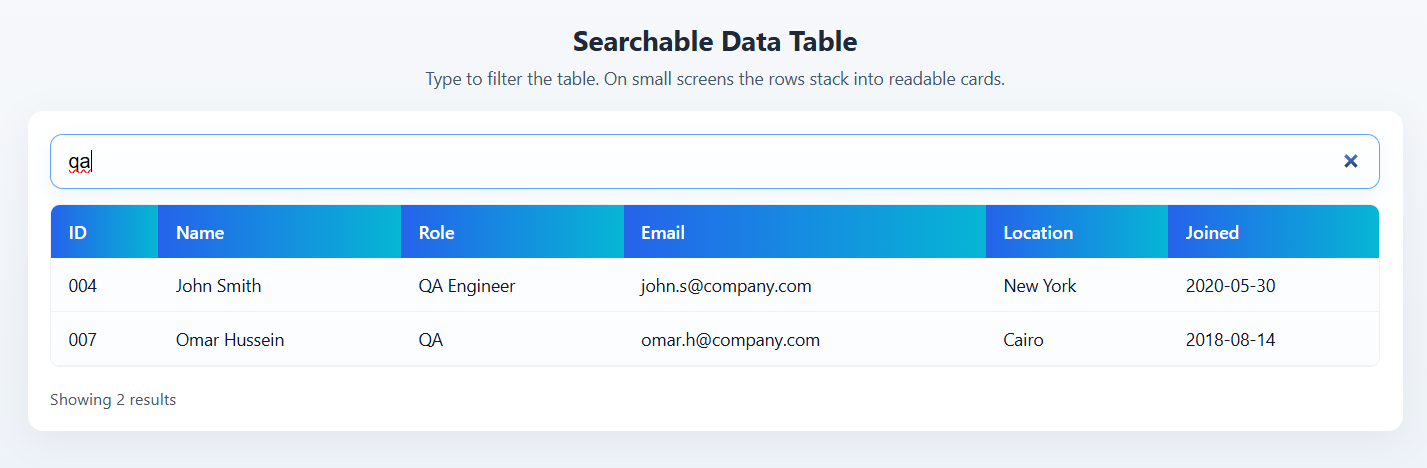
This is a searchable HTML data table that filters rows live as the user types. The JavaScript automatically assigns data-label attributes so on small screens the table collapses into readable card-style rows showing column labels.
How to Create HTML Data Tables Using CSS and JavaScript
1. Data Table
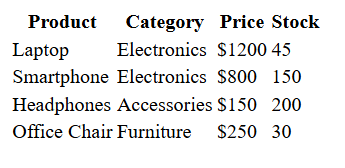
This is a simple starting point to understand the structure of a table:
HTML:
<table>
  <thead>
    <tr>
      <th>Product</th>
      <th>Category</th>
      <th>Price</th>
      <th>Stock</th>
    </tr>
  </thead>
  <tbody>
    <tr>
      <td>Laptop</td>
      <td>Electronics</td>
      <td>$1200</td>
      <td>45</td>
    </tr>
    <tr>
      <td>Smartphone</td>
      <td>Electronics</td>
      <td>$800</td>
      <td>150</td>
    </tr>
    <tr>
      <td>Headphones</td>
      <td>Accessories</td>
      <td>$150</td>
      <td>200</td>
    </tr>
    <tr>
      <td>Office Chair</td>
      <td>Furniture</td>
      <td>$250</td>
      <td>30</td>
    </tr>
  </tbody>
</table>
Teaching points:
-
<thead>contains the header row for the table. -
<tbody>contains all data rows. -
<th>are header cells;<td>are regular cells.
Tip: Start simple. Always structure tables semantically so they’re easy to read and style.
You may look: Best Examples of CSS for HTML Tables
2. Styled Data Table
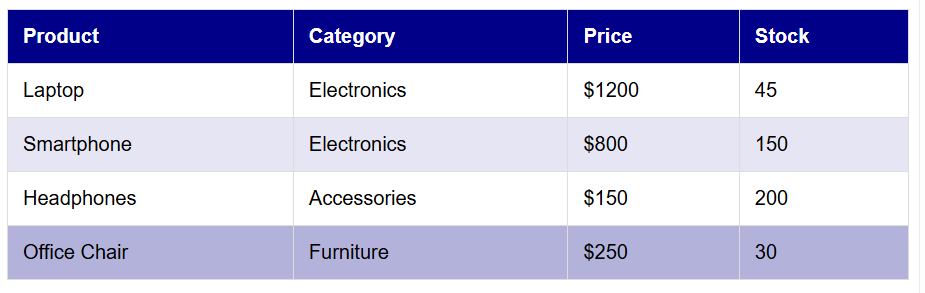
Add some CSS to make the table look modern and readable:
-
Zebra stripes help users follow rows in long tables.
-
Hover effect makes it easier to see which row is being read.
-
Header color differentiates the top row.
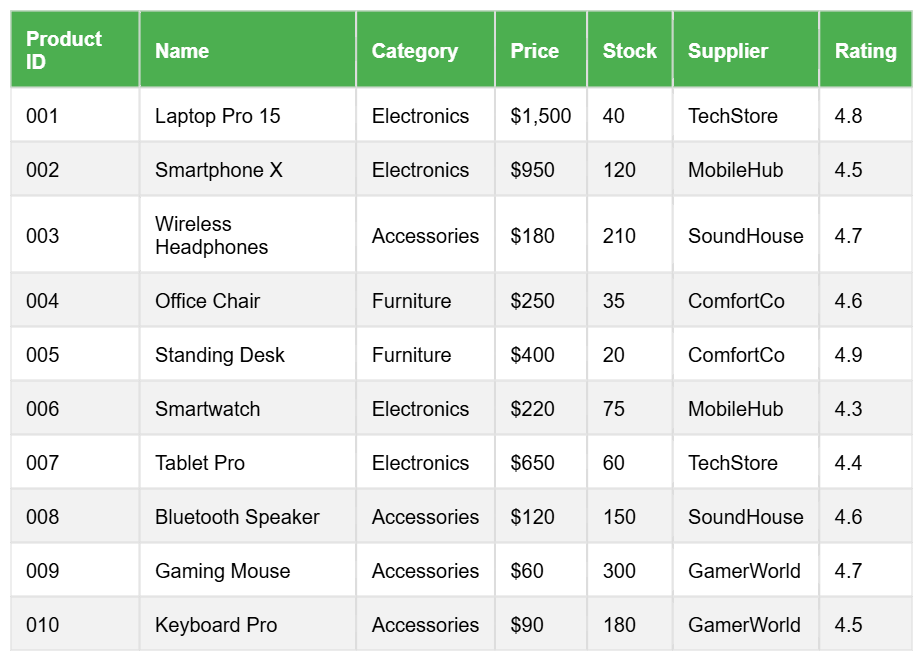
3. Long Data Table Example
Sometimes, tables have many rows, like reports or lists. Here’s an example of a long data table for a product catalog:
HTML:
<table>
  <thead>
    <tr>
      <th>Product ID</th>
      <th>Name</th>
      <th>Category</th>
      <th>Price</th>
      <th>Stock</th>
      <th>Supplier</th>
      <th>Rating</th>
    </tr>
  </thead>
  <tbody>
    <tr>
      <td>001</td>
      <td>Laptop Pro 15</td>
      <td>Electronics</td>
      <td>$1,500</td>
      <td>40</td>
      <td>TechStore</td>
      <td>4.8</td>
    </tr>
    <tr>
      <td>002</td>
      <td>Smartphone X</td>
      <td>Electronics</td>
      <td>$950</td>
      <td>120</td>
      <td>MobileHub</td>
      <td>4.5</td>
    </tr>
    <tr>
      <td>003</td>
      <td>Wireless Headphones</td>
      <td>Accessories</td>
      <td>$180</td>
      <td>210</td>
      <td>SoundHouse</td>
      <td>4.7</td>
    </tr>
    <tr>
      <td>004</td>
      <td>Office Chair</td>
      <td>Furniture</td>
      <td>$250</td>
      <td>35</td>
      <td>ComfortCo</td>
      <td>4.6</td>
    </tr>
    <tr>
      <td>005</td>
      <td>Standing Desk</td>
      <td>Furniture</td>
      <td>$400</td>
      <td>20</td>
      <td>ComfortCo</td>
      <td>4.9</td>
    </tr>
    <tr>
      <td>006</td>
      <td>Smartwatch</td>
      <td>Electronics</td>
      <td>$220</td>
      <td>75</td>
      <td>MobileHub</td>
      <td>4.3</td>
    </tr>
    <tr>
      <td>007</td>
      <td>Tablet Pro</td>
      <td>Electronics</td>
      <td>$650</td>
      <td>60</td>
      <td>TechStore</td>
      <td>4.4</td>
    </tr>
    <tr>
      <td>008</td>
      <td>Bluetooth Speaker</td>
      <td>Accessories</td>
      <td>$120</td>
      <td>150</td>
      <td>SoundHouse</td>
      <td>4.6</td>
    </tr>
    <tr>
      <td>009</td>
      <td>Gaming Mouse</td>
      <td>Accessories</td>
      <td>$60</td>
      <td>300</td>
      <td>GamerWorld</td>
      <td>4.7</td>
    </tr>
    <tr>
      <td>010</td>
      <td>Keyboard Pro</td>
      <td>Accessories</td>
      <td>$90</td>
      <td>180</td>
      <td>GamerWorld</td>
      <td>4.5</td>
    </tr>
  </tbody>
</table>
-
This table shows 10 rows of products — you can expand it to 50 or 100 rows.
-
When tables get long, zebra stripes and hover effects are crucial for readability.
-
Adding more columns like Supplier or Rating helps teach beginners how to handle multiple data points.


Comments (0)